Setup & Indicator
- RSI: Period 14, levels: 30 (oversold), 70 (overbought)
- Timeframe: M15–H1 for swing and day trading
- Confirmation: Bullish/bearish candlestick pattern (e.g., hammer, shooting star)
Entry
- Long: RSI drops below 30, forms a divergence (e.g., rising lows in RSI vs. falling price lows), then turns back above 30.
- Short: RSI rises above 70, is confirmed by a reversal candle, then falls back below 70.
Exit
- Stop-loss: 5–10 pips beyond the last local low/high
- Take profit: 50% of the stop (conservative) or when RSI returns to the neutral band (40–60)
Risk Management
- Only trade in clearly range-bound or slowly trending phases
- Maximum 1% risk per trade; otherwise, sit out
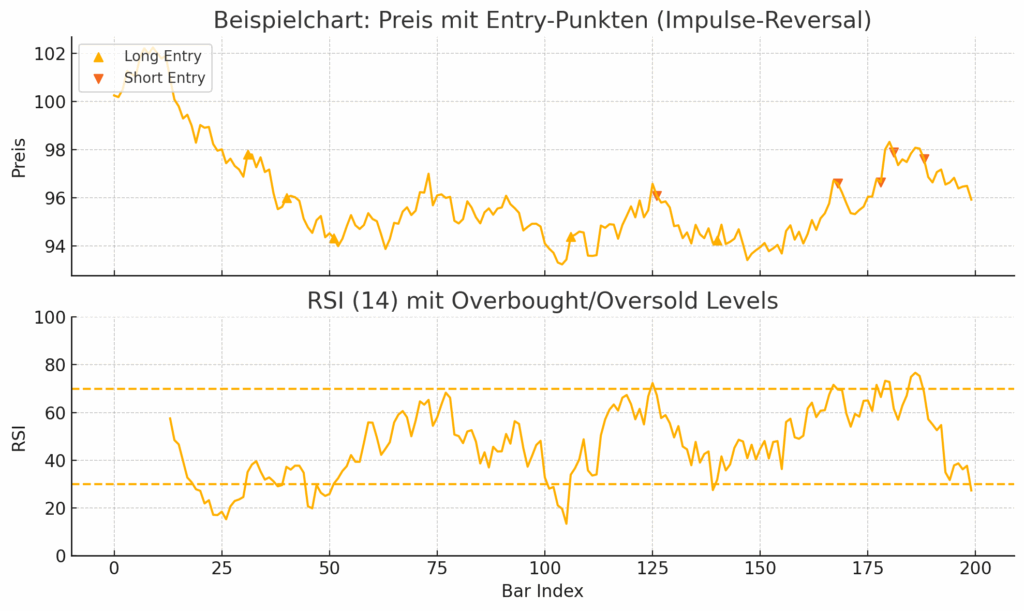
- Upper panel (price): A fictional price line with markers for long (▲) and short entries (▼).
- Lower panel (RSI 14): The RSI with levels 30 (oversold) and 70 (overbought).
- Long signal: RSI falls below 30 and then crosses back up.
- Short signal: RSI exceeds 70 and then crosses back down.
This lets you visualize the entry before you additionally use a candlestick reversal pattern as confirmation.