Setup & Indicators
- Fast EMA: Period 10
- Slow EMA: Period 50
- Timeframe: H1 or H4
- Additional filter: ATR(14) > 0.0005 for minimum volatility
Entry
- Long: EMA10 crosses EMA50 from below and ATR indicates sufficient trend strength.
- Short: EMA10 crosses EMA50 from above.
Exit & Trailing
- Stop-loss: 1.5 × ATR(14) below/above the crossover point.
- Take profit: 2 × risk (risk/reward = 1:2) or dynamically via trailing stop = 1 × ATR.
Risk Management
- Max. risk per trade: 1–2% of account equity.
- Position size: Choose volume so that SL distance × volume ≤ max risk.
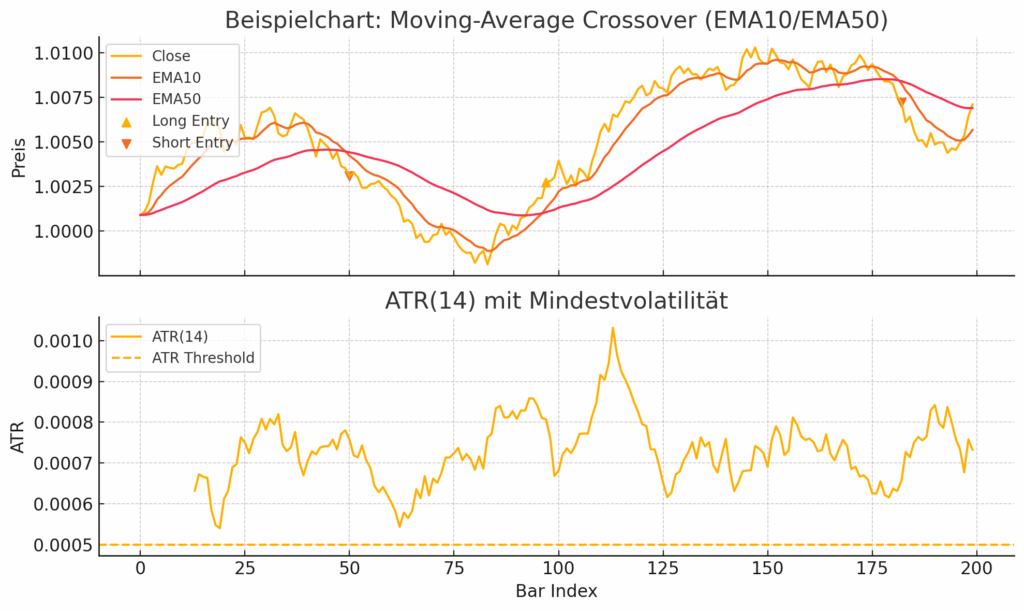
- Upper panel (price with EMAs):
- Yellow line: Close price
- Orange line: EMA10
- Red line: EMA50
- ▲ Long entry, ▼ short entry, only when ATR(14) > 0.0005
- Lower panel (ATR(14)):
- Yellow line: ATR(14)
- Dashed line: Minimum volatility (0.0005)
Chart Interpretation
- Long entry: EMA10 crosses EMA50 from below and ATR(14) is above the threshold.
- Short entry: EMA10 crosses EMA50 from above with sufficient volatility.
- Stop-loss & take profit: Based on 1.5 × ATR below/above the cross and R/R = 1:2 or ATR-based trailing.
This gives you a visual check of the setup in the H1/H4 context before applying risk management (1–2 % per trade, position sizing).