Setup & Components
- Tenkan (9), Kijun (26), Senkou Span B (52), adjust cloud colors
- Timeframe: H4/D1 for maximum significance
- Filter: Trend direction based on cloud position
Entry
- Long: Price > cloud and Tenkan crosses Kijun from below.
- Short: Price < cloud and Tenkan crosses Kijun from above.
- Note: Chikou Span (lagging line) should not be blocked by price.
Exit
- Stop-loss: Beyond the cloud edge (Senkou Span A/B) or at the Kijun level.
- Take-profit: When Tenkan/Kijun cross again or when price falls back into the cloud.
Risk Management
- Only trade in the trend direction (price not inside the cloud).
- Volume scaling: Halve position size after every second swing high/low.
- Price (candles)
- Candlesticks on a black background show each day’s open–high–low–close.
- Tenkan-sen (9-period, red line)
- Short-term trend line, calculated as the average of the 9-period high and low.
- Kijun-sen (26-period, blue line)
- Medium-term trend line, average of the 26-period high and low.
- Senkou Span A & B (cloud, orange fill)
- Senkou A (green line): (Tenkan + Kijun)/2, shifted 26 periods forward
- Senkou B (brown line): Average of the 52-period high/low, shifted 26 periods forward
- The cloud (Kumo) is shaded orange:
- Light orange when Senkou A > Senkou B (bullish)
- Dark orange when Senkou A < Senkou B (bearish)
- Chikou Span (green lagging line)
- Today’s closing price shifted 26 periods back. Shows whether current bullish momentum is confirmed.
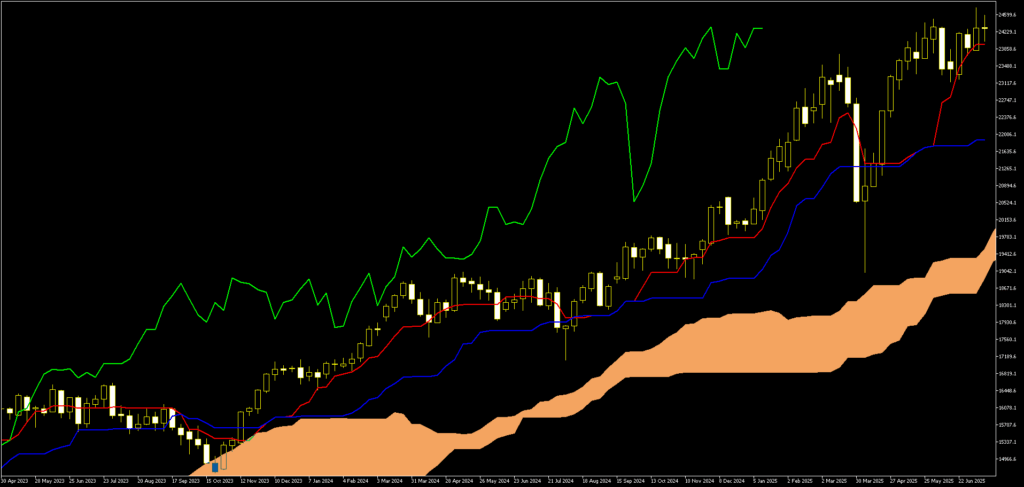
What the chart shows
- Overall bullish trend:
- Price remains consistently above the cloud.
- Senkou A clearly above Senkou B (light cloud).
- Tenkan and Kijun are rising.
- Entry signal (long):
- Around the blue bars (December 2023), Tenkan (red) crosses Kijun (blue) from below.
- At the time of the cross, price is already above the cloud — trend filter satisfied.
- Chikou Span runs above price and is not blocked by the cloud.
- This combination generates the marked long entry.
- Follow-through:
- After the cross, price continues higher, confirmed by rising Tenkan/Kijun and a thickening cloud.
- Several subsequent crosses on the weekly timeframe allowed new entries, while the cloud acted as dynamic support.
How to interpret this for your trading
- Trend filter: Take trades only when price & Chikou Span are clearly above (or below) the cloud.
- Entry: Tenkan/Kijun cross in the direction of the higher-timeframe trend.
- Stop-loss: Directly beyond the cloud edge (Senkou Span A/B) or at the Kijun level.
- Exit: Either on an opposite cross or on a drop back into the cloud — then close or trail the position.
The chart ideally illustrates how Ichimoku unites all key trend, momentum, and support/resistance signals in a single view.