Setup & Tools
- Fibonacci Retracement: Levels 38.2%, 50%, 61.8%
- Timeframe: H1–D1 for reliable trend phases
- Confirmation: Candlestick patterns (Pin Bar, Engulfing)
Entry
- Draw the tool from the swing low to the swing high (uptrend), or vice versa.
- Long: Price tests 50% or 61.8% and forms a bullish engulfing or hammer.
- Short: Analogous at the retracement levels in a downtrend.
Exit
- Stop-Loss: 5 pips beyond the next Fibonacci level.
- Take Profit: 100% level (swing high or low) or extensions (127.2%, 161.8%).
Risk Management
- Only take trades with confluence (e.g., overlapping trendline or MA50).
- Max. 1.5% risk per trade.
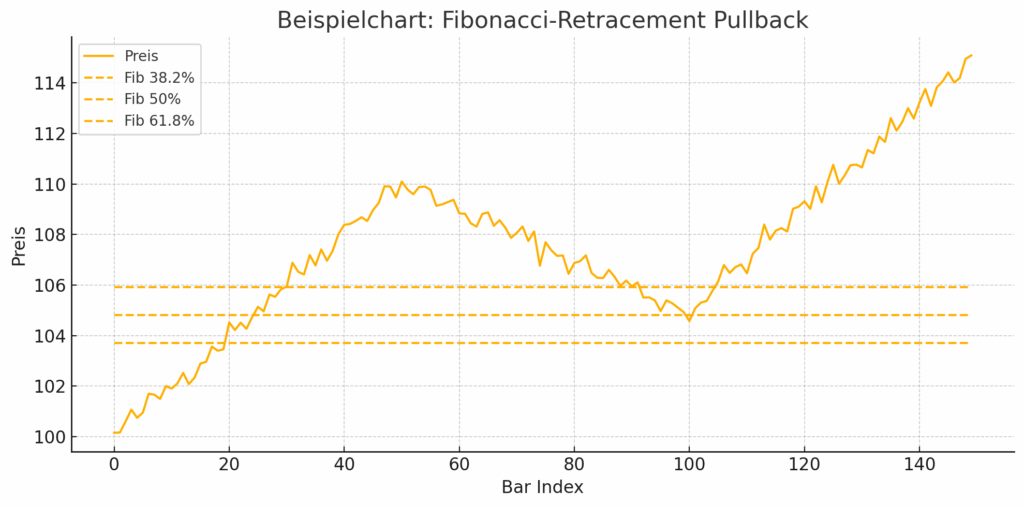
- Price action: Uptrend (bars 0–49), pullback (50–99), trend continuation (100–149).
- Fibonacci levels (between swing low at ~100 and swing high at ~110):
- Fib 38.2% (~103.82)
- Fib 50% (~105.00)
- Fib 61.8% (~106.18)
- Entry markers: ▲ Entries at the 61.8% and 50% levels once price tests and reverses with a counter move (bullish engulfing/hammer).
Legend
- Yellow line: Close price
- Dotted lines: Fibonacci levels
- ▲ Entries at retracement levels
With this example, you can identify pullbacks at key levels and deliberately wait for candlestick confirmations (e.g., hammer, engulfing). Set the stop-loss 5 pips beyond the next Fib level and take profit at the swing high or at extensions (127.2%, 161.8%).