Setup & Indicator
- Bollinger Bands: Period 20, StdDev 2
- Timeframe: M30–H1 for more frequent squeezes
- Volume filter: Low ATR² value or VIX-like index
Entry
- Identify a squeeze: Bands contract tightly (bandwidth < 0.5 × average).
- Breakout: Close outside the upper band → long, or outside the lower band → short.
Exit & Trailing
- Stop-loss: At the middle band (MA20) or a few pips back into the band.
- Trailing: Fixed distance (e.g., 20–30 pips) or dynamic adjustment along the upper/lower band line.
Risk Management
- Open a position only when volume (MT5 volume histogram) is rising.
- No trading during high-impact news (news filter in the EA).
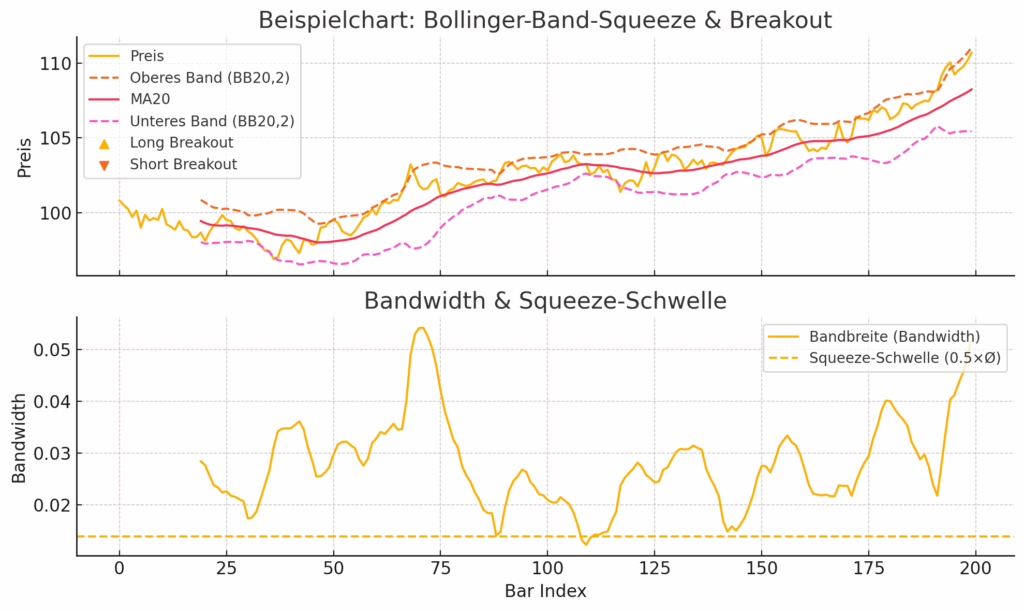
- Upper panel (price with Bollinger Bands):
- Yellow line: Close price
- Dotted lines: Upper and lower bands (BB20,2)
- Red line: Middle band value (MA20)
- ▲ Long breakout: Close after a squeeze outside the upper band
- ▼ Short breakout: Close after a squeeze outside the lower band
- Lower panel (Bandwidth):
- Yellow line: Bandwidth = (Upper − Lower band) / MA20
- Dashed line: Squeeze threshold = 0.5 × average bandwidth
Explanation
- Squeeze phase: When bandwidth drops below the threshold, it indicates low volatility.
- Breakout: After a squeeze, a close outside the bands triggers a long (upper) or short (lower) trade.
- Volume filter & news: In practice, also ensure volume (e.g., the MT5 volume histogram) is rising and no high-impact news are scheduled before entering.
- Stop-loss & trailing: Stop near the middle band or a few pips back; trailing stop fixed (20–30 pips) or dynamic along the band.
This chart provides a visual template for how squeeze phases and subsequent breakouts appear in the M30–H1 context.